State Key Laboratory of Numerical Modeling for Atmospheric Sciences and
Geophysical Fluid Dynamics (LASG)
Institute of Atmospheric Physics, Chinese Academy of Sciences

Vol. 4/No.4 December 2017
[Model development, algorithm, and evaluation] A New Interpretation of the Ability of Global Models to Simulate the MJO
Key Points:
1. All 27 simulations produced large-scale eastward propagating signals in precipitation (the MJO) but with different occurrence frequencies
2. There is no statistically significant distinction in the strength and propagation speeds of MJO events simulated by most of these models
3. It is hypothesized that a model can produce the MJO only in a particular background state
Statistical diagnostics have led to a common perception that only few global models can reproduce the MJO. Here we demonstrate, using a method of tracking individual MJO events, that this perception is incorrect. Of 27 global model simulations diagnosed, all produced large-scale slowly eastward propagating signals in precipitation, which are taken as manifestations of the MJO. The difference is some model produced them frequently, others infrequently. There is no statistically significant distinction between the strength and propagation speeds of MJO events produced by most of these models. A hypothesis is proposed to interpret our results: A model can produce the MJO only in a particular background state. If the background state of a model can be constantly in a condition that is conducive to its production of the MJO, this model simulates the MJO frequently. If not, this model can still produce the MJO but only infrequently when its seasonal background state occasionally migrates into a condition that is conducive to its production of the MJO. Preliminary results from testing this hypothesis are presented.
The results from this study indicate that the enigma of global model simulations of the MJO is not why some models can and others cannot produce the MJO. It is not even why some models produce strong and others weak MJO events. It is why some models produce the MJO frequently and other infrequently. We hypothesized that the central piece of this puzzle is the background state. The importance of the background state has been proposed by many to explain differences in MJO statistics simulated by different models. Here we extend it to explain how occurrence frequency of simulated MJO, which is the main reason for simulated MJO statistics, depends on seasonal background states that may vary from year to year within a given model.
Our results may also explain the conundrum wherein a model may produce statistical signals of the MJO in its climate simulation but its MJO prediction skill using observed initial conditions is very low, or it may predict the MJO well but cannot produce MJO statistics in a climate simulation. It all depends on the background state that allows it to produce the MJO. If that background state is close to the observed, this model may predict the MJO well starting from an observed initiation condition until its background state drifts away as the lead time increases. But this model may not be able to simulate MJO statistics if the seasonal background state in its climate simulation is very different from the observed most of time. If the background state conducive to MJO production by a model is very different from observations, this model may produce MJO statistics in its climate simulation but it may not predict the MJO well with observed initial conditions.
URL:http://onlinelibrary.wiley.com/doi/10.1002/2017GL073891/abstract
Ling, J., Zhang, C., Wang, S., & Li, C. (2017). A new interpretation of the ability of global models to simulate the MJO. Geophysical Research Letters, 44(11), 5798-5806. DOI: 10.1002/2017GL073891
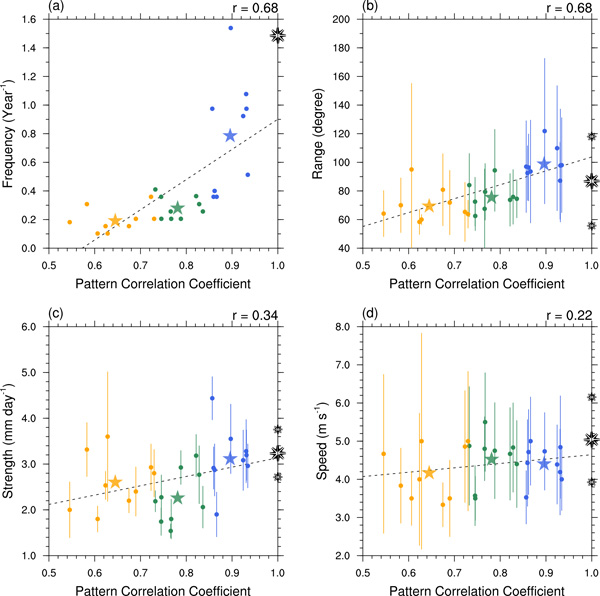
Figure caption
Scatter diagrams of MJO simulation skill scores in terms of pattern correlation vs. averaged (a) occurrence frequencies (events/year), (b) propagation ranges (longitude), (c) strength (averaged rain rate in mm day-1), and (d) speeds (m s-1) of tracked MJO events in the model simulations. Their correlation coefficients are given on the upper-right corners. Blue, green, and orange dots represent models of the top, middle, and bottom tiers, respectively, as defined in Figure 1a, and the corresponding stars represent their means. Vertical whiskers mark one standard deviations. Black dotted lines denote linear fit by least squares means. Large and small octagonal stars on the right ordinates mark observed means and one standard deviations. Pattern correlation between the models and TRMM was calculated for 60˚E - 180˚ and -20 – 20 days。
E-mail: lasg_newsletter@lasg.iap.ac.cn
Editors: Chuanyi Wang (wangcy@lasg.iap.ac.cn), Kangjun Chen(ckj@lasg.iap.ac.cn)