State Key Laboratory of Numerical Modeling for Atmospheric Sciences and
Geophysical Fluid Dynamics (LASG)
Institute of Atmospheric Physics, Chinese Academy of Sciences

Vol. 4/No.4 December 2017
[Model development, algorithm, and evaluation] Precipitation extremes in China and their Possible Mechanisms by Regional Climate Model and Earth System Model Simulations
Highlights:
Precipitation extremes over the dry regions of China had positive regression coefficients versus the SST of the eastern tropical Pacific Ocean (ETP)
Quantified rates of change in future precipitation extremes with surface air temperature (tas).
Possible mechanisms of precipitation extremes were analyzed using atmospheric water vapor equation.
Precipitation extremes are of general interest due to their profound impacts on the society, economy, human safety, and the natural environment. Precipitation extremes exhibit high spatiotemporal variation in terms of both their frequency and intensity relative to the mean precipitation, so it is always difficult to detect extreme events and their underlying related mechanisms.
Recently, Dr. QIN Peihua and Prof. XIE Zhenghui from LASG/Institute of Atmospheric Physics, Chinese Academy of Sciences, investigated the connections between the precipitation extremes during 1953–2002 in the dry and wet regions of China and the sea surface temperature (SST) in the eastern tropical Pacific Ocean (ETP) based on two sets of observations, CMIP5 models and regional climate models (Fig. 1). In the dry region of China, the extreme precipitation indices had positive regression coefficients versus the SST of the ETP for all data sets, but the linear relationships of the extreme indices with the SST were more complex in the wet region (Fig. 2).
Correlation analysis between the precipitation extreme indices and the climate factors showed that the precipitation extremes were more sensitive to the annual and seasonal mean precipitation, total water vapor, and upward vertical wind over most river basins in China (Fig. 3).
The rates of increases in R95p in the mid-future (MF: 2039–2058) with tas relative to those in the current period (RF: 1982–2001) ranged from 3.36% per oC in the sourthern China to 6.2% per oC in the northwestern China. Moreover, the rates of increase in R95p for the far future (FF: 2079–2098) with tas had larger amplitudes compared to those in the MF period, where they ranged from 6.92% per oC in SC to 8.2% in NC. Finally, a formula for estimating the changes in precipitation extremes was derived based on the water vapor equation.
References
Qin, P., and Z. Xie (2016), Detecting changes in future precipitation extremes over eight river basins in China using RegCM4 downscaling, J. Geophys. Res. Atmos., 121, doi:10.1002/2016JD024776.
Download: http://onlinelibrary.wiley.com/doi/10.1002/2016JD024776/full
Qin, P., and Z. Xie (2017), Precipitation extremes in the dry and wet regions of China and their connections with the sea surface temperature in the eastern tropical Pacific Ocean, J. Geophys. Res. Atmos., 122, doi:10.1002/2016JD026242.
Download: http://onlinelibrary.wiley.com/doi/10.1002/2016JD026242/full
Qin P., Z. Xie, S. Liu and J. Zou (2017), Future precipitation extremes in China under climate change and their possible mechanisms by regional climate model and earth system model simulations. J. Geophys. Res. Atmos, under review.
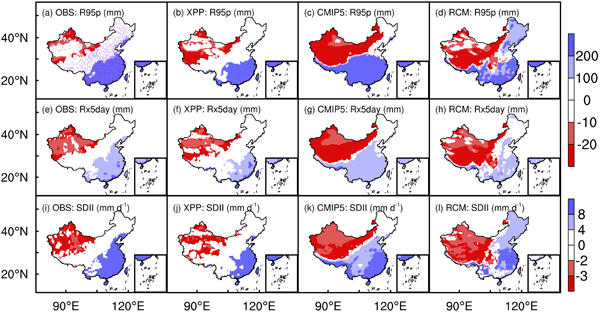
Figure 1. Spatial patterns of the average of precipitation extremes (R95p, Rx5day, and SDII) in China for the (a, e, and i) OBS, (b, f, and j) XPP, (c, g, and k) ensemble of CMIP5 models, and (d, h, and l) ensemble of RCM models. The locations of the OBS stations are marked by purple dots. The extremes in the dry region are marked as negative values to clearly indicate both the dry and wet regions.
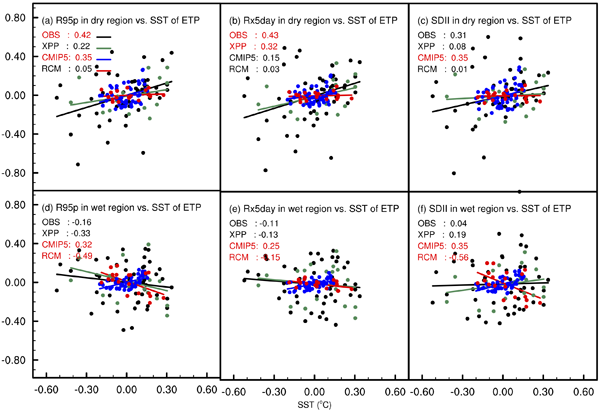
Figure 2. Scatterplots for the normalized annual time series of precipitation extreme indices (R95p, Rx5day, and SDII) in the (a–c) dry regions and (d–f) wet regions versus the SST in the ETP obtained from the observations (OBS and XPP), ensemble of 17 CMIP5 models, and ensemble of nine RCM models. The solid lines in Figures a–f show the linear regression, where the slopes of the linear regression are denoted in red if they were significant at the p < 0.1 level according to a t test.
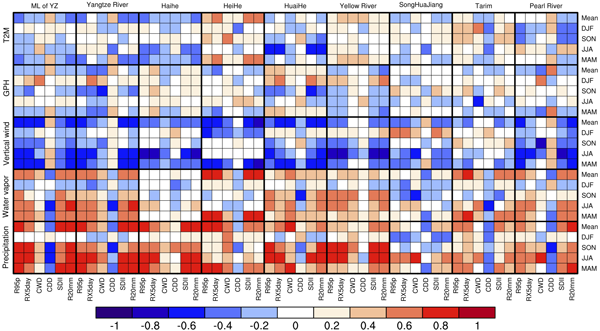
Figure 3. Correlation coefficients between precipitation extreme indices (R95p, Rx5day, CWD, CDD, SDII, and R20mm) and the seasonal/annual climate factors (precipitation, total water vapor, vertical wind, and geopotential height (GPH) at 850 hPa, 2 m temperature) for future period from 2032 to 2051 over the eight river basins in China. Middle and lower reaches of the Yangtze River Basin (ML of YZ) are also shown here.
E-mail: lasg_newsletter@lasg.iap.ac.cn
Editors: Chuanyi Wang (wangcy@lasg.iap.ac.cn), Kangjun Chen(ckj@lasg.iap.ac.cn)