State Key Laboratory of Numerical Modeling for Atmospheric Sciences and
Geophysical Fluid Dynamics (LASG)
Institute of Atmospheric Physics, Chinese Academy of Sciences

Vol. 4/No.4 December 2017
[Climate Dynamics] What Lead to the Invasion of Strong Cold Events to Southern China?
Highlights: The southward invasion of strong cold air to eastern China south of 40°N is related to two factors. One is the latitudinal location of a mid-upper level wave train over the mid- to high-latitude Eurasian continent, surface Siberian high, and the mid-tropospheric East Asian trough and the other is a subtropical upper-level wave train emanating from the mid-latitude North Atlantic.
Previous studies have been focused on strong cold events that influence the broad East Asian region, and few studies have been conducted about strong cold events reaching southern China, which is more vulnerable to cold events than northern China due to lack of needed infrastructure and experience.
The study of Dr. Lei Song and Prof. Renguang Wu investigated why some strong cold events can reach eastern China south of 40°N but some other cold events cannot. A comparative analysis of the two types of strong cold events (i.e., strong south cold events and strong north cold events) reveals two important differences between these two types of events. One difference is the latitudinal location of the mid-upper level wave train over the mid- to high-latitude Eurasian continent, the surface Siberian high, and the mid-tropospheric East Asian trough (Fig. 1). The other difference is a subtropical upper-level wave train emanating from the mid-latitude North Atlantic that only appears in the north cold events. When the mid- to high-latitude wave train is located too far northward and the subtropical wave train induces an anomalous mid-tropospheric high over southern China, the East Asian trough does not extend southwestward and the Siberian high does not expand southeastward (Fig. 1b). In such cases, the cold air mainly affects northeastern China and northern Japan. The southward invasion of strong cold events to southern China requires that the north wave train can reach mid-latitudes and there is no south wave train along the subtropics (Fig. 1a).
The strong south cold events tend to occur during the decaying negative AO phase (Fig. 2a), whereas the strong north cold events happen in the developing negative AO stage (Fig. 2b). During strong south cold events, the Siberian high intensifies accompanying the increase of negative temperature anomalies in the north region (Fig. 2a). During strong north cold events, the Siberian high does not amplify and the NAO is in its positive phase (Fig. 2b).
During strong north cold events, a subtropical wave train is detected to emanate from the North Atlantic about one week before and propagate eastward (Fig. 3a). The wave train leads to an anomalous high over southern China that restrains the southwestward deepening of the East Asian trough and the southward invasion of cold air. A barotropic model simulation with anomalous divergence imposed over the mid-latitude North Atlantic reproduces a wave train along the subtropical jet (Fig. 3b), confirming the role of the North Atlantic perturbation related to the NAO in the generation of the wave train. Distinct from the north cold events, neither an obvious wave train along the subtropics, nor an anomalous divergence over the mid-latitude North Atlantic are observed for the south cold events.
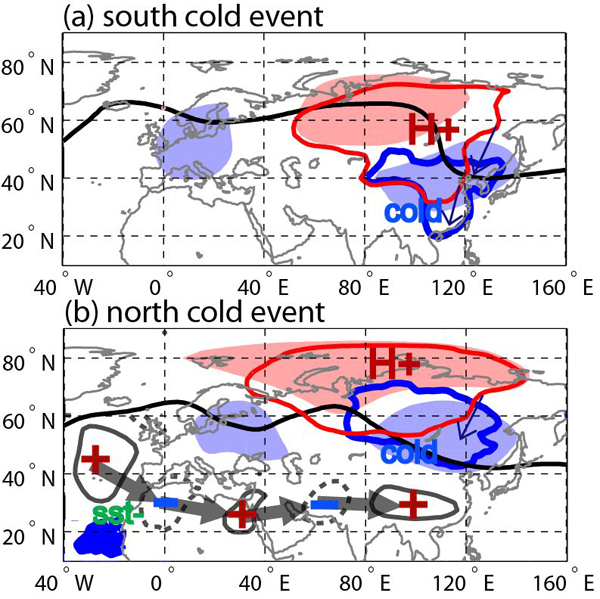
Figure 1 Schematic diagram showing features corresponding to strong (a) south and (b) north cold events. The red contour denotes the Siberian high, the blue contour denotes the cold anomaly, the black contour refers to the 500-hPa geopotential height contour at 5300 gpm, the light blue and red shadings denote negative and positive geopotential height anomalies at 500-hPa, the bold-gray arrows denote the subtropical wave train, and the blue arrows denote anomalous lower-level winds.
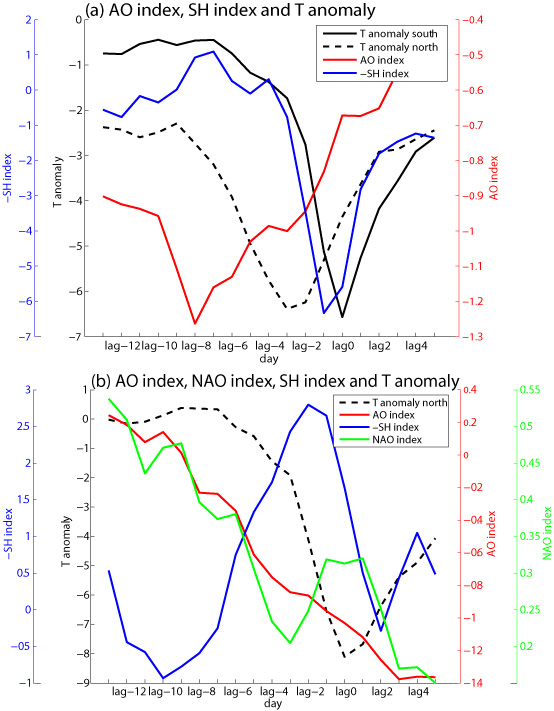
Figure 2 (a) Time evolution of surface air temperature anomalies (ºC) in the north and south regions, the Siberian high index (hPa), and the AO index during lag -13 to lag 5 days of strong south cold events. (b) Same as (a), but for strong north cold events, and the NAO index is added.

Figure 3 (a) Hovmöller diagram of geopotential height anomalies (gpm) at 300-hPa along 25°N-35°N during strong north cold events. The black crosses indicate anomalies significant at the 95% confidence level. (b) Hovmöller diagram of geopotential height anomalies (gpm) along 25°N-35°N from the barotropic model run with an anomalous divergence of -1.74×10⁻⁶s-1 imposed with the center at 45ºN and 20ºW.
Reference:
Song, L. and R. Wu, 2017: Processes for Occurrence of Strong Cold Events over Eastern China. J. Climate, 30, 9247–9266, https://doi.org/10.1175/JCLI-D-16-0857.1
E-mail: lasg_newsletter@lasg.iap.ac.cn
Editors: Chuanyi Wang (wangcy@lasg.iap.ac.cn), Kangjun Chen(ckj@lasg.iap.ac.cn)