State Key Laboratory of Numerical Modeling for Atmospheric Sciences and
Geophysical Fluid Dynamics (LASG)
Institute of Atmospheric Physics, Chinese Academy of Sciences

Vol. 3/No.3 August 2017
Attribution of the July–August 2013 heat event in Central and Eastern China
The observed and simulated frequency, intensity, and duration of some extreme weather and climate events have been changing as the climate system has warmed. Extreme event attribution has drawn the interest of the public and been a topic of climate change research because of the severely devastating impacts of extreme events. An individual extreme weather or climate event can occur because of natural internal variability, and can also be influenced by anthropogenic factors, along with the rare sample of extreme events. It’s thus difficult to determine the extent to which climate change influences an individual extreme events.
In the midsummer of 2013, Central and Eastern China (CEC) was hit by an extraordinary heat event, with the region experiencing the warmest July–August on record. To explore how human-induced greenhouse gas emissions and natural internal variability contributed to this heat event, Dr. MA Shuangmei from Chinese Academy of Meteorological Sciences, her Ph.D advisor, Prof. ZHOU Tianjun from the CAS Institute of Atmospheric Physics and their American, Austrian and Japanese collaborators compared observed July–August mean surface air temperature (SAT) with that simulated by climate models. They find that both atmospheric natural variability and anthropogenic factors contributed to this heat event. This extreme warm midsummer was associated with a positive high-pressure anomaly that was closely related to the stochastic behavior of atmospheric circulation. Diagnosis of CMIP5 models and large ensembles of two atmospheric models indicates that human influence has substantially increased the chance of warm mid-summers such as 2013 in CEC.
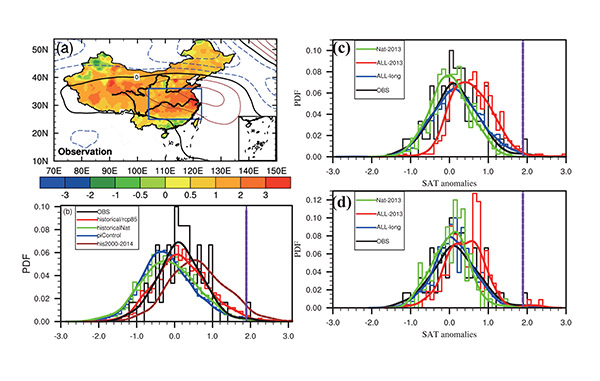
(a) 2013 July–August mean SAT anomalies (°C, shaded) and geopotential height anomalies at 500 hPa (Z500, units in m, contours) relative to the base period. Histogram (bars) and probability density functions (PDFs, curve) of July–August mean SAT anomalies averaged over Central and Eastern China derived from (b) CMIP5,(c) CAM5.1and (d) MIROC5simulations. The vertical purple lines in (b)-(d) are the observed 2013 July–August SAT anomaly. (Image by MA Shuangmei)
Reference:
Ma Shuangmei, Zhou Tianjun*, Stone Daithi, Angelil Oliver, Shiogama Hideo, 2017: Attribution of the July-August 2013 Heat Event in Central and Eastern China to Anthropogenic Greenhouse Gas Emissions. Environmental Research Letters, 12(5), 054020.
http://iopscience.iop.org/article/10.1088/1748-9326/aa69d2
Contact: ZHOU Tianjun, zhoutj@mail.iap.ac.cn
E-mail: lasg_newsletter@lasg.iap.ac.cn
Editors: Chuanyi Wang (wangcy@lasg.iap.ac.cn), Kangjun Chen(ckj@lasg.iap.ac.cn)