State Key Laboratory of Numerical Modeling for Atmospheric Sciences and
Geophysical Fluid Dynamics (LASG)
Institute of Atmospheric Physics, Chinese Academy of Sciences

Vol. 3/No.3 August 2017
Wetting and greening Tibetan Plateau in early summer in recent decades
Highlights:
1. The amount, frequency and intensity of precipitation in May over the Tibetan Plateau have increased significantly since 1979.
2. Soil moisture content and vegetation activities in the early summer increased as a response to the wetting trend.
3. The wetting trend in May is a direct result of the earlier onset of South Asian summer monsoon associated with the phase transition of Interdecadal Pacific Oscillation (IPO).
Known as the “water tower of Asia”, the Tibetan Plateau (TP) is the source of the ten largest rivers in Asia, supporting more than 1.4 billion people and exerting a substantial influence on the water resources, agriculture, and ecosystems of the downstream countries.Unlike the well-recognized surface warming, changes in precipitation over the TP and the underlying mechanisms remain ambiguous. Then it is interesting to know what robust changes in precipitation have occurred over the TP? How have the hydrological and ecological systems responded? What is responsible for the precipitation changes over the TP?
Recently,Ph.D Candidate ZHANG Wenxia, Prof. ZHOU Tianjun and Dr. ZHANG Lixia from Institute of Atmospheric Physics, Chinese Academy of Sciences investigated precipitation changes over the TP on the monthly timescale, based on homogenized daily rain gauge data. A significant increase in the amount of precipitation over 1979–2014 occurs only in May, at the rate of 13.46% decade−1(of the climatology). Both increased precipitation frequency and intensity have contributions (Figure 1). The coherent increases in the soil moisture content and vegetation activities confirm the precipitation trend, indicating a wetting and greening TP in the early summer in recent decades (Figure 2).
Then what has caused the wetting trend in May over the TP? The moisture budget analysis reveals the dominant role of increased water vapor convergence due to circulation changes – the low level southwesterly anomalies over the northern Indian Ocean which then promote moisture convergence and increased precipitation over the TP in May. Theanomalous southwesterlies result directly from the earlier onset of the South Asian summer monsoon since the late 1970s associated with the phase transition of IPO around the late 1990s (Figure 3).
This work has important implications for the relationship between climate change over the TP and large-scale air-sea interaction and the influence of precipitation changes on the regional hydrological cycle and ecosystem.
This work is published in Journal of Geophysical Research: Atmospheres.
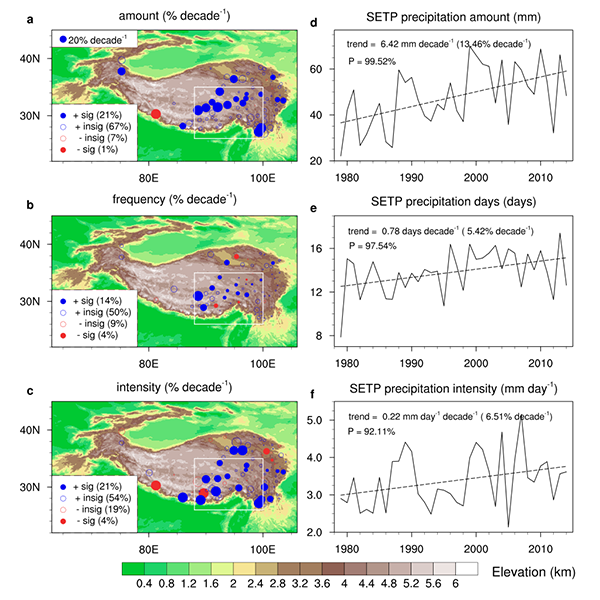
Figure 1. Linear trends of the (a) amount, (b) frequency, and (c) intensity of precipitation in May during 1979-2014 (% decade-1 relative to the climatology). Blue (red) circles denote positive (negative) trends, with sizes representing the magnitudes. Closed circles indicate the 5% significance level. Shading denotes the elevation (km). The percentages of stations in the same trend category are given in parentheses. Time series of the (d) amount (unit: mm), (e) precipitation days (days), and (f) intensity (mm day-1) of precipitation in May averaged over the southeastern TP (white boxes in a-c; 27° –33° N, 88° –100° E). Dashed lines are linear fit of the time series. The linear trends of the mean precipitation over all stations in the southeastern TP and Mann-Kendall probability levels are given in the top-left.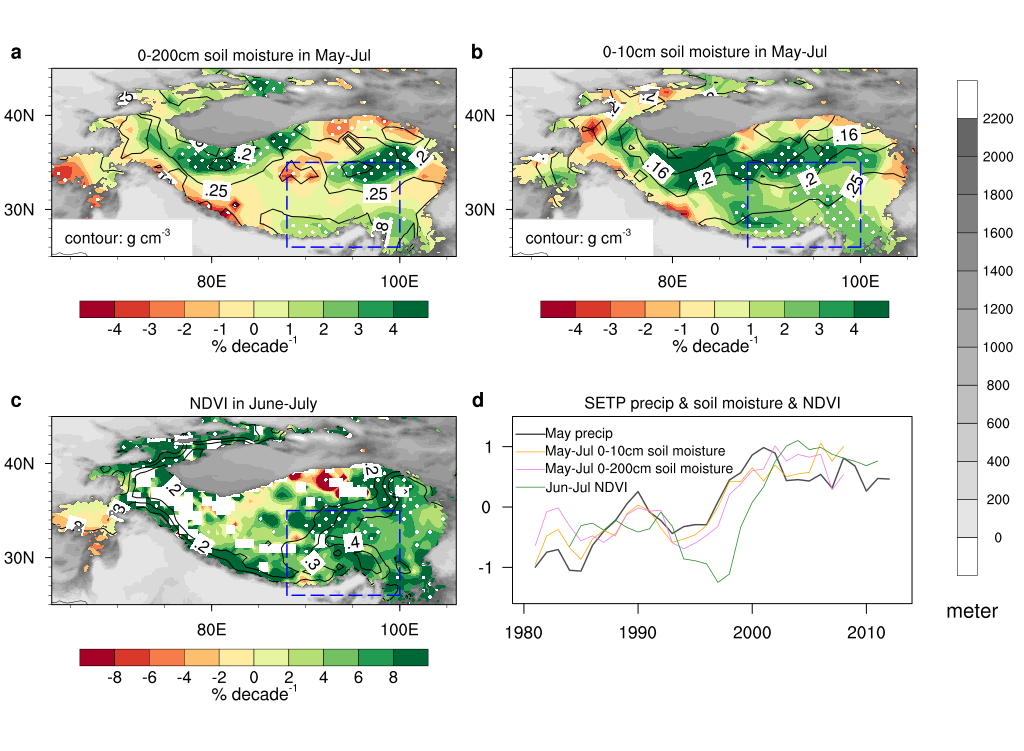
Figure 2. Climatology (contours: g cm-3) and trends (shadings: % decade-1 of the climatology) of (a) 0–200 cm and (b) 0–10 cm soil moisture content in May–July during 1979–2010. (c) Same as (a) but for the NDVI in June–July during 1982–2013 (contours: 1; shadings: % decade-1). Stippling indicates significance at the 5% level. Grey shadings denote elevation of the topography (m). (d) Normalized time series of the amount of precipitation in May, soil moisture content in May–July, and NDVI in June–July averaged over the southeastern TP (blue boxes in a–c; 26° –35° N, 88° –100° E), with a five-year running smooth.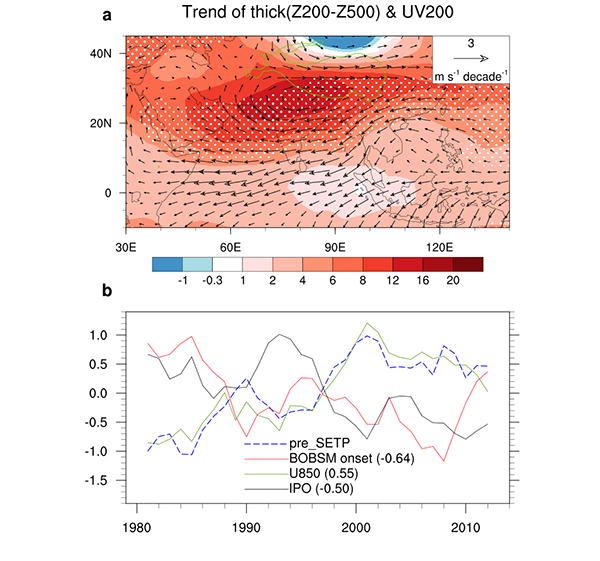
Figure 3. (a) Linear trends in 200–500 hPa atmospheric thickness (shadings, gpm decade-1) and 200-hPa winds (vectors, m s-1 decade-1) in May during 1979-2014. Stippling indicates significance at the 5% level. (b) Normalized time series of precipitation over the southeastern TP in May (blue), the onset date of the Bay of Bengal (BOB) summer monsoon (red; 10° –20° N, 85° –95° E; negative values indicate early onset), the 850-hPa zonal winds in the northern Indian Ocean (green; 5° –15° N, 60° –95° E; positive values indicate early onset), and the IPO index averaged from March to May (black). The time series are three-year running smoothed. The correlation coefficients between precipitation and other indices, estimated using non-smoothed de-trended time series, are shown in parentheses.
Reference:
Zhang, W., T. Zhou, and L. Zhang (2017), Wetting and greening Tibetan Plateau in early summer in recent decades, J. Geophys. Res. Atmos., 122, doi:10.1002/2017JD026468.
http://onlinelibrary.wiley.com/doi/10.1002/2017JD026468/full
Contact: ZHOU Tianjun, zhoutj@mail.iap.ac.cn
E-mail: lasg_newsletter@lasg.iap.ac.cn
Editors: Chuanyi Wang (wangcy@lasg.iap.ac.cn), Kangjun Chen(ckj@lasg.iap.ac.cn)