State Key Laboratory of Numerical Modeling for Atmospheric Sciences and
Geophysical Fluid Dynamics (LASG)
Institute of Atmospheric Physics, Chinese Academy of Sciences

Vol. 2/No.2 April 2017
[Climate Change]What causes uncertainty of 2°C threshold-crossing time?
Highlights:
- The 2°C threshold-crossing time can differ by 20 years across climate models.
- Climate sensitivity and warming rate are two factors determining the uncertainty of when 2°C will reach.
- The warming in different China regions are affected by different radiative processes related to climate sensitivity.
The warming target below 2°C at the end of this century was written in the Paris Agreement, and an even higher target of below 1.5°C is under discussion. But when will we see the 2°C warming over China? It depends on scenarios of anthropogenic green-house gas emission. However, for a given scenario, the estimated 2°C threshold-crossing time (TCT) differs from model to model. Much larger model spread is seen when we focus on regional scale. What is the factor responsible for the uncertainty?
Recently, Dr. CHEN and Prof. ZHOU Tianjunfrom Institute of Atmospheric Physics, Chinese Academy of Sciencesinvestigated the uncertainty of 2°C threshold-crossing time over the China region based on two future scenarios (RCP4.5 and RCP8.5) from 40 climate models participating the Coupled Model Intercomparison Project – Phase 5 (CMIP5). Their results show that the averaged warming over China may breach the 2°C threshold around 2030 in both the scenarios. However, the crossing time in models with the fastest and slowest warming can differ by at least 20 years (Fig. 1). Large spread in models’ climate sensitivity is one of the most important factors (Fig. 2). The other factor is warming rate, slower warming leading to larger uncertainty of threshold-crossing time.
Climate sensitivity, or the global mean temperature change under doubled CO2 concentration relative to the pre-industrial level, strongly depends on how physical processes are described in climate models. The higher climate sensitivity is in a model, the stronger is green-house effect; and the less stratus cloud over the monsoon region, the less snow cover on the Tibetan Plateau. These changes increase the downward longwave and shortwave radiation and decrease the shortwave reflected by the surface, all of which advance the local 2°C threshold-crossing time (Fig. 3).
The investigation focusing on 2°C warming target has important implication for the uncertainty of 1.5°C threshold-crossing time at regional and global scales.
The result published in Science Bulletin.
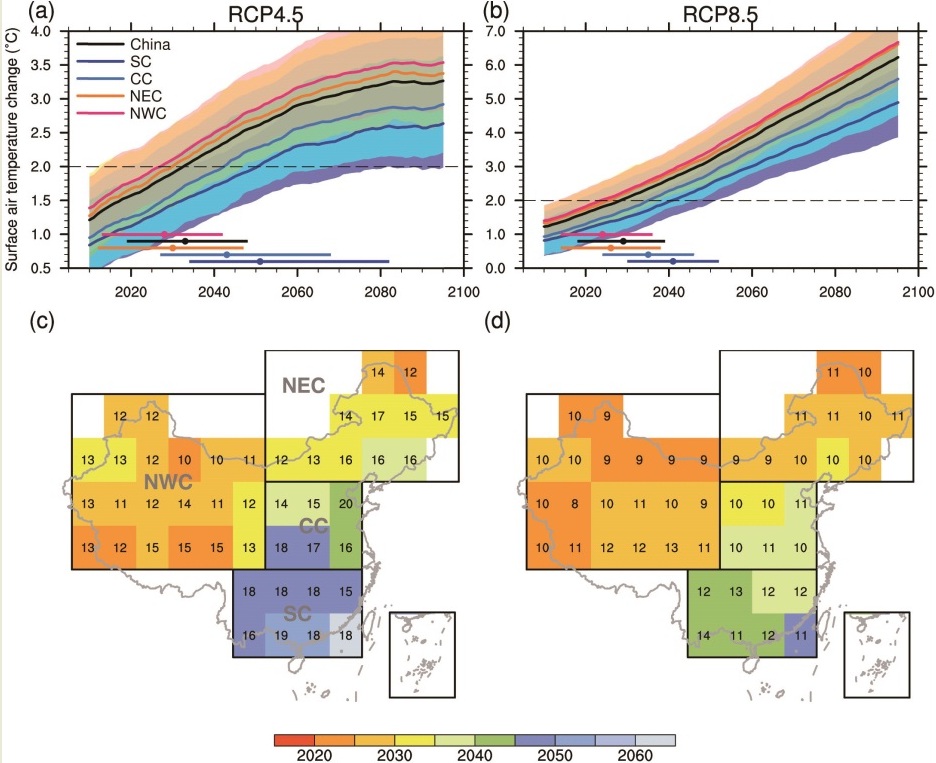
Fig. 1 (a) Multi-model projected annual mean surface air temperature anomalies (unit: °C) relative to the pre-industrial mean state (1861–1890) under the RCP4.5 scenario in the China region and the four sub-regions of China: southern China (SC), central China (CC), northeastern China (NEC), and northwestern China (NWC). Shadings denote intermodel uncertainty in a range of ±1σ. The bars parallel to the time axis are the range of 2°C TCT, and the dots within are the multi-model mean, i.e., the crossing time of the solid lines with the 2°C dashed line; upper and lower bounds are crossing time of shadings with the 2°C dashed line. (c) Spatial distribution of 2°C TCT (shadings) and corresponding intermodel standard deviation (numbers), along with the areas of the four sub-regions. (b) and (d) are the same as (a) and (b), but for RCP8.5.
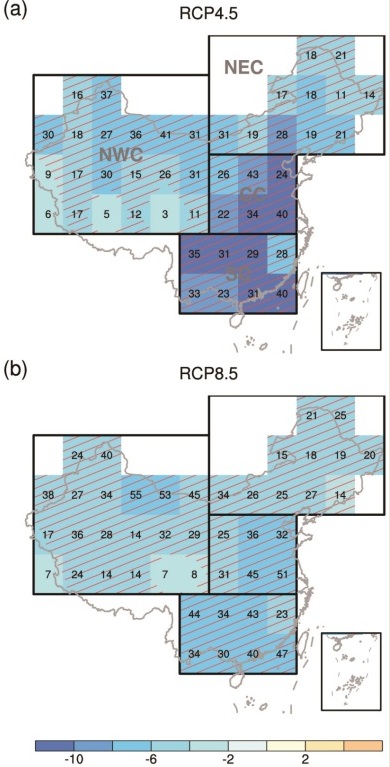
Fig 2. (a) Under the RCP4.5 scenario, 2°C TCT anomalies (shadings; unit: a) associated with normalized intermodel global mean SAT changes during 2070–2099. Negative values mean the advance time of 2°C TCT when climate sensitivity is 1°C higher. Striped regions exceed the 5 % significance level under the t-test. Numbers denote the percentage of intermodel TCT variance explained by climate sensitivity (units: %). (b) is the same as (a) but for RCP8.5.
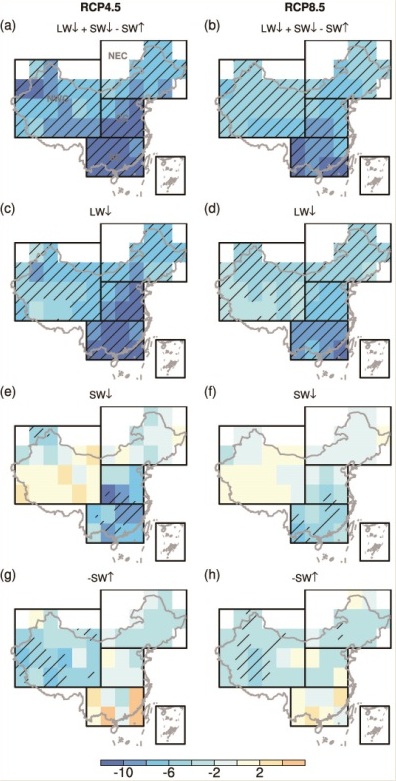
Fig 3. Intermodel anomalies of 2°C threshold-crossing time associated with local surface radiation changes under RCP4.5 (left column) and RCP8.5 (right column) scenarios. Negative value denotes advanced time. Downward longwave corresponds to green-house effect, reflecting water vapor-lapse rate feedback; downward shortwave corresponds to changes in stratus cloud, reflecting cloud shortwave feedback; upward shortwave corresponds to changes in snow cover, reflecting surface albedo feedback. Stripped regions exceed 95% confidence level.
Citation:
Chen, Xiaolong, Tianjun Zhou, 2016 Uncertainty in crossing time of 2°C warming threshold over China. Sci. Bull., 61(18):1451–1459, doi:10.1007/s11434-016-1166-z.
http://link.springer.com/article/10.1007/s11434-016-1166-z
E-mail: lasg_newsletter@lasg.iap.ac.cn
Editors: Chuanyi Wang (wangcy@lasg.iap.ac.cn), Kangjun Chen(ckj@lasg.iap.ac.cn)