State Key Laboratory of Numerical Modeling for Atmospheric Sciences and
Geophysical Fluid Dynamics (LASG)
Institute of Atmospheric Physics, Chinese Academy of Sciences

Vol. 2/No.2 April 2017
[Climate Dynamics] Linking a Sea Level Pressure Anomaly Dipole over North America to the Central Pacific El Niño
The El Niño-Southern Oscillation (ENSO) phenomenon, which originates in the tropical Pacific, is the strongest natural interannual climate signal and has received much attention because of both its worldwide climatic and economic effects. It has been increasingly recognized that there are two different flavors or types of El Niño events in the tropical Pacific. The new type of El Niño is known as the Central Pacific El Niño (CP El Niño), which exhibits maximum positive sea surface temperature (SST) anomalies in the central equatorial Pacific, rather than the eastern equatorial Pacific as seen during conventional El Niño episodes.
Recently, Prof. DING Ruiqiang (LASG, IAP, CAS), together with his collaborators,demonstrateda close connection between the north–south dipole pattern of sea level pressure (SLP) anomalies over northeastern North America to the western tropical North Atlantic, referred to as the North American dipole (NAD) (Figure 1), and the CP El Niño a year later. In contrast to other ENSO precursors, such as the North Pacific Oscillation (NPO) and Pacific–North America (PNA) pattern, the NAD appears more closely related to the CP-type El Niño than to the eastern Pacific (EP)-type El Niño, indicating that the NAD may serve as a unique precursor for the CP El Niño (Figure 2). The wintertime NAD induces SST anomalies in the northern tropical Atlantic (NTA), which subsequently play an important role in developing the CP El Niño-like pattern in the tropical Pacific over the course of the following year. It appears that the NAD influence on CP El Niño involves air–sea interaction over several major basins, including the subtropical/tropical Pacific and the NTA. Additional analysis indicates that the correlation of either the NAD index or the NPO index with the CP El Niño state a year later depends on the status of the other index. When the wintertime NAD index is of the opposite sign to the simultaneous NPO index, the correlation of the NAD or NPO index with the Niño4 index becomes much weaker.
The paper has been published in Climate Dynamics in 2017.
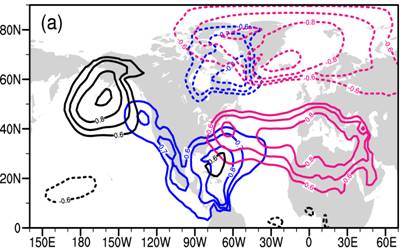
Figure 1.Correlation maps of the winter (NDJFM) averaged SLP anomalies with the simultaneous PNA (black contours), NAD (blue contours), and NAO (red contours) indices. The contour interval is 0.1. Only correlations greater than 0.6 are shown.

Figure 2. (a) Time series of the winter (NDJFM) averaged NAD index (black bars), Niño1+2 (yellow line), Niño3 (light blue line), Niño3.4 (dashed green line), and Niño4 (red line) indices a year later. All indices are standardized, and the correlation coefficients of the NAD index with four NINO indices a year later are given in Table 1. (b) Regression of the winter averaged SST anomalies (contour interval 0.1°C) in the tropical Pacific onto the previous winter NAD index. Positive (red) and negative (blue) SST anomalies, significant at the 95% confidence level, are shaded.
Citation:
Ding, R. Q., J. Li, Y. H. Tseng, C. Sun, F. Zheng(2017), Linking a sea level pressure anomaly dipole over North America to the central Pacific El Niño,Clim.Dyn., online, doi:10.1007/s00382-016-3389-8.
Download: http://link.springer.com/article/10.1007/s00382-016-3389-8
Contact:DINGRuiqiang, drq@mail.iap.ac.cn
E-mail: lasg_newsletter@lasg.iap.ac.cn
Editors: Chuanyi Wang (wangcy@lasg.iap.ac.cn), Kangjun Chen(ckj@lasg.iap.ac.cn)