中国科学院大气物理研究所大气科学和地球流体力学数值模拟国家重点实验室
State Key Laboratory of Numerical Modeling for Atmospheric Sciences and
Geophysical Fluid Dynamics (LASG)
Institute of Atmospheric Physics, Chinese Academy of Sciences
State Key Laboratory of Numerical Modeling for Atmospheric Sciences and
Geophysical Fluid Dynamics (LASG)
Institute of Atmospheric Physics, Chinese Academy of Sciences

Vol.11/No.11 November 2019
Linking Quasi-biweekly variability of the South Asian High to Atmospheric Heating over Tibetan Plateau in Summer
However, a recent study by Professor REN Rongcai at the State Key Laboratory of Atmospheric Sciences and Geophysical Fluid Dynamics (LASG), Institute of Atmospheric Physics, Chinese Academy of Sciences and her coauthors, indicates a different relationship in shorter timescale between the SAH and the atmospheric heat-source over TP. Namely, the SAH center tends to locate over Iranian Plateau (IP or the IP phase of the SAH) during anomalously stronger TP heat-source days, but moves to TP (or the TP phase) during weaker TP heat-source days (Fig. 1).
The team further demonstrate that the IP/TP phase of SAH coincides with stronger/weaker low surface pressure anomalies over TP. The stronger/weaker ascending and upper-tropospheric divergence anomalies above TP, associated with stronger/weaker TP heat-source, connect to compensatory stronger descending and upper-tropospheric convergence anomalies over IP, and thus a stronger SAH over IP; Meanwhile, the much stronger low Ps anomalies, and the stronger ascending anomalies over TP, as well as the much elevated TP heating, result in the negative geopotential anomalies at the altitude where the SAH locates (Fig. 2). Such day-to-day coupling between SAH and the TP heat-source exhibits a quasi-biweekly (QBW) time scale with a pronounced westward propagating signal.
This work has been published in Climate Dynamics.
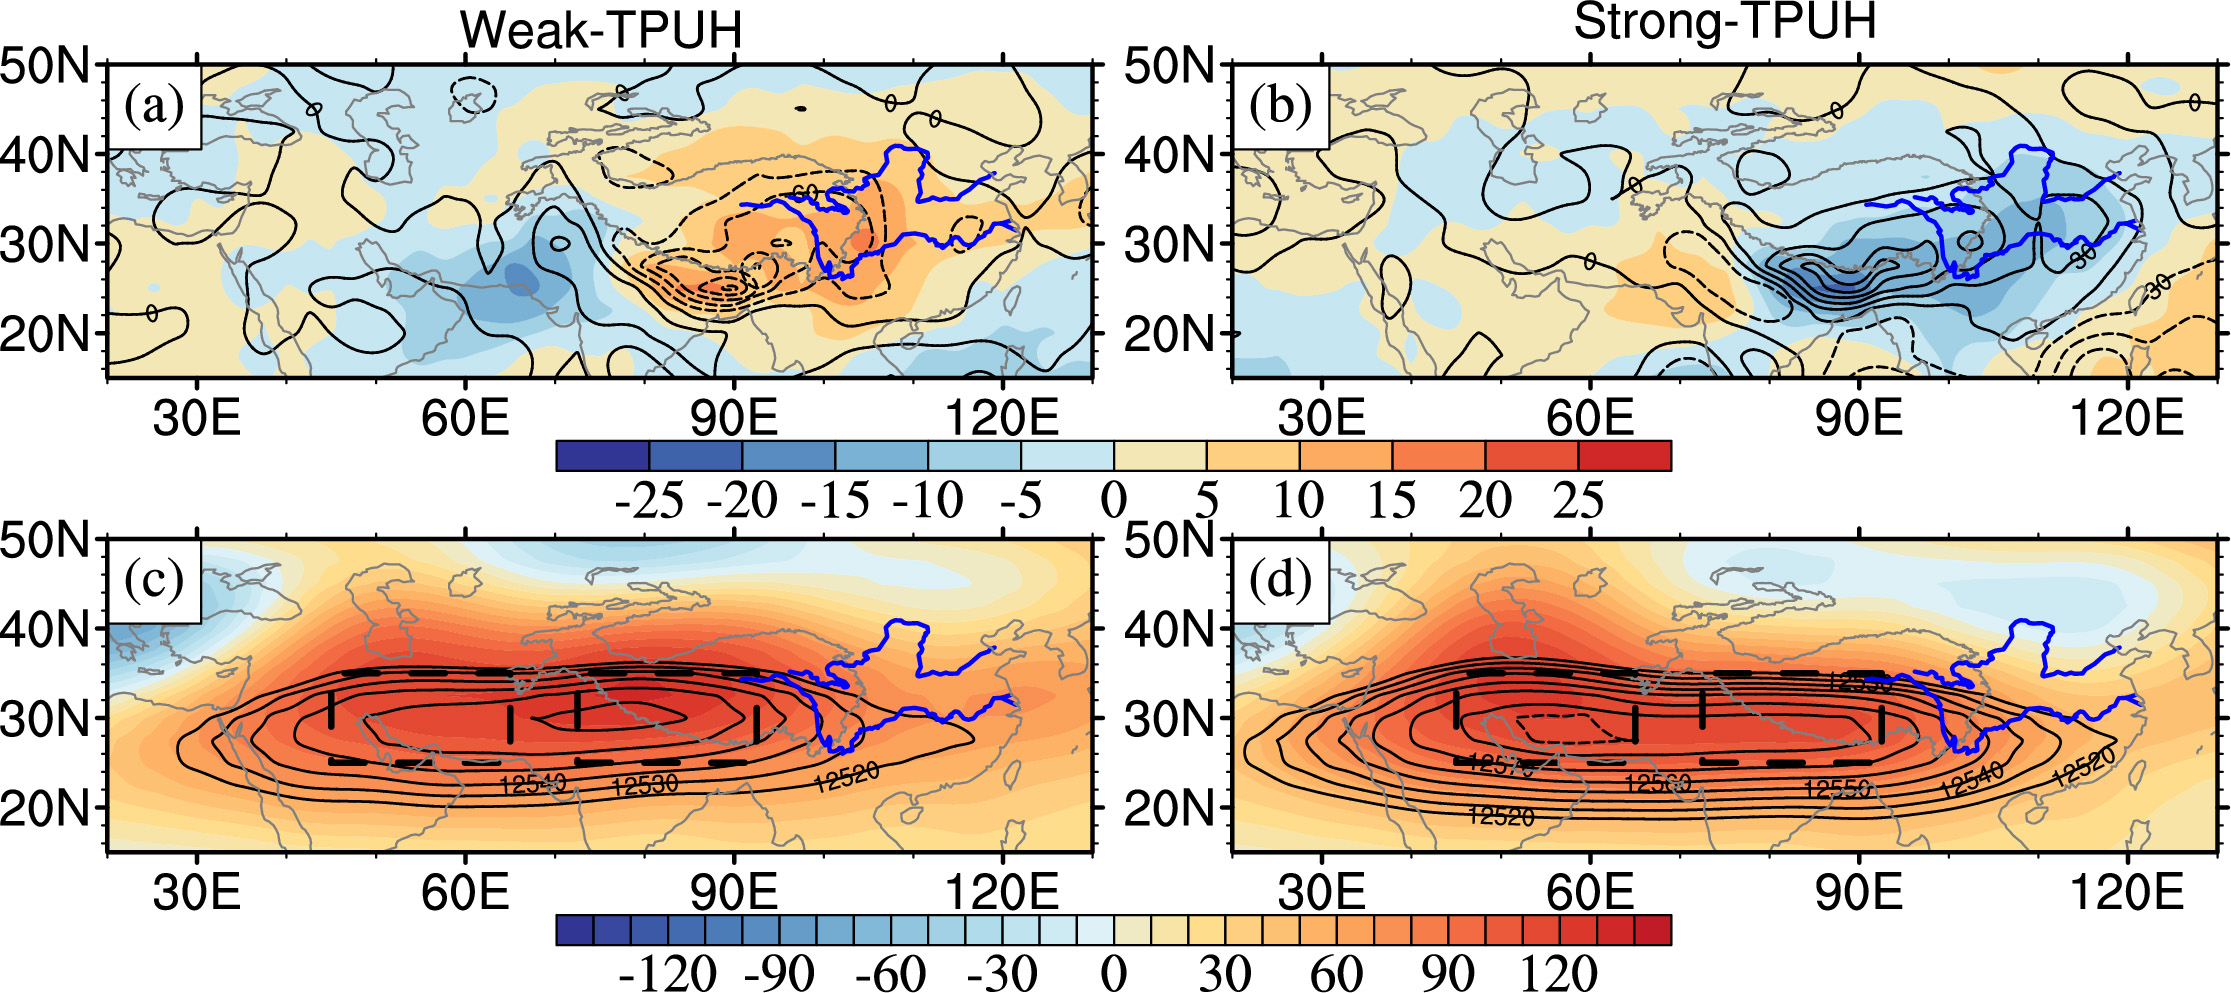
Fig. 1 Composite (a, b) daily anomalies of vertical accumulated Q1 (units: W m−2; contours; interval: 30) and OLR (units: W m−2; shaded); and (c, d) daily geopotential height (contours; interval: 10; contours above 12520 gpm) and its zonal deviation (shaded) at 200hPa. The left column is for days when TRUHS are below its normal by one standard deviation (STD) and the right for positive TPUHS anomalies above one STD. The rectangles mark the TP and IP regions for the definition of the SAH index.
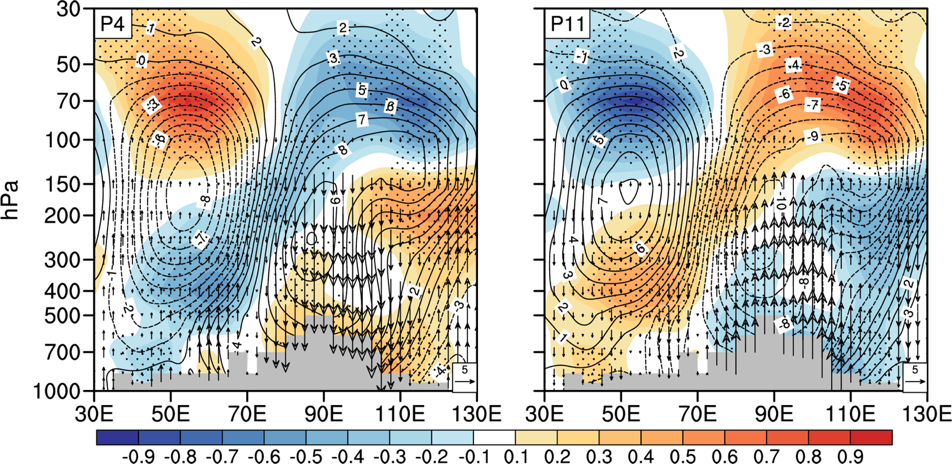
Fig. 2 Pressure–longitude cross-sections of the composite anomalies of potential temperature (units: K; shading), geopotential height (units: gpm; contours), and vertical motion ω (units: 10−3 Pa s−1; arrows) anomalies along the SAH ridgeline (27.5°–37.5°N), when TP heat-source is in its valley (P4) and peak (P11) phase, and SAH is in its TP (P4) and IP (P11) phase.
Citation:
Ren, Rongcai, Chuandong Zhu and M. Cai, 2019: Linking Quasi-biweekly variability of the South Asian High to Atmospheric Heating over Tibetan Plateau in Summer, Climate Dynamics, 53: 3419-3429, DOI 10.1007/s00382-019-04713-4.
https://doi.org/10.1007/s00382-019-04713-4
Contact: REN Rongcai, rrc@lasg.iap.ac.cn
Add: No.40, Huayanli, Beichen West Road, Chaoyang District, Beijing P.O. Box 9804, 100029, China
E-mail: lasg_newsletter@lasg.iap.ac.cn
Editors: Chuanyi Wang (wangcy@lasg.iap.ac.cn), Kangjun Chen(ckj@lasg.iap.ac.cn)
E-mail: lasg_newsletter@lasg.iap.ac.cn
Editors: Chuanyi Wang (wangcy@lasg.iap.ac.cn), Kangjun Chen(ckj@lasg.iap.ac.cn)