State Key Laboratory of Numerical Modeling for Atmospheric Sciences and
Geophysical Fluid Dynamics (LASG)
Institute of Atmospheric Physics, Chinese Academy of Sciences

Vol. 10/No.10 August 2019
Formation of cold season snow cover anomalies over the Tibetan Plateau
Highlights: Snow cover anomalies over the central-eastern Tibetan Plateau are mainly formed in autumn and their impacts are most prominent in spring. The central-eastern Tibetan Plateau snow cover anomalies have month‐to‐month persistence during October through April. The Tibetan Plateau snow cover anomalies in cold seasons are influenced by large‐scale atmospheric circulation anomaly pattern of different paths.
Summary: Tibetan Plateau snow is an important component of the climate system. Previous studies mostly focused on the influence of the Tibetan Plateau snow anomalies on regional climate variability. The formation of snow cover anomalies over the Tibetan Plateau is still unclear.
Recently, Dr. WANG Zhibiao, Prof. WU Renguang and coauthors found that the snow‐related surface heat flux and atmospheric heat source anomalies increase from autumn to spring (Fig. 1), whereas precipitation anomalies are most prominent in autumn. This implies that snow cover anomalies over the central-eastern Tibetan Plateau are mainly formed in autumn and their impacts are most prominent in spring. The snow cover anomalies in central-eastern Tibetan Plateau display month‐to‐month persistence during October through April, indicative of a large contribution of persistence to snow cover anomalies in winter and spring. The Tibetan Plateau snow cover anomalies in cold seasons are influenced by large-scale atmospheric circulation anomaly pattern of different paths. In autumn, a wave pattern extends from the North Pacific through the North Atlantic to the Tibetan Plateau (Fig. 2a), induced by eastern North Pacific and western North Atlantic sea surface temperature (SST) anomalies (Fig. 2b), which is verified by the AGCM experiment with SST anomalies specified in the North Pacific and the North Atlantic (Fig. 2c). In winter, a North Atlantic Oscillation related wave pattern from the North Atlantic to East Asia may contribute to snow cover anomalies. In spring, a mid-latitude wave pattern originating over the western North Atlantic and propagating through the Mediterranean Sea to southern Tibetan Plateau may have a supplementary contribution to snow cover anomalies. The sources for cold season snow cover anomalies over the central-eastern Tibetan Plateau are summarized in a schematic diagram shown in Fig. 3.
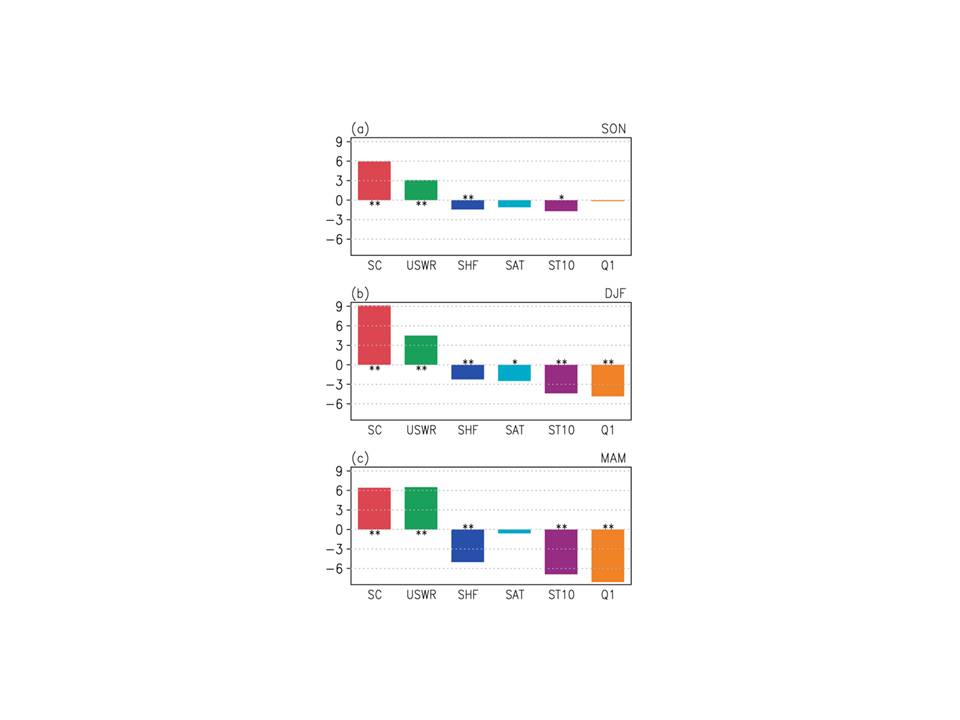
Figure 1. Concurrent anomalies of snow cover (SC) (%), upward shortwave radiation (USWR) (W/m2), sensible heat flux (SHF) (W/m2), surface air temperature (SAT) (0.1°C), soil temperature at 0–10cm (ST10) (0.1°C), and total heat source in the atmospheric column (Q1) (W/m2) averaged over the central-eastern Tibetan Plateau region obtained by linear regression against (a) SON, (b) DJF, and (c) MAM interannual snow cover index in the central-eastern Tibetan Plateau region. The one and two asterisks denotes anomalies significant at the 95% and 99% confidence level, respectively.
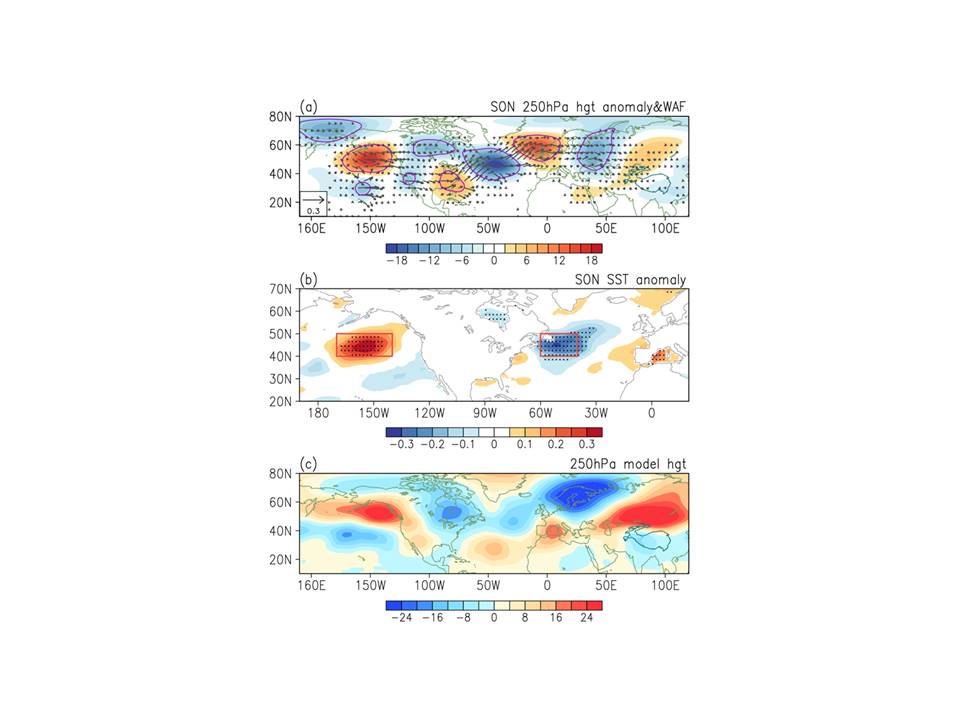
Figure 2. Anomalies of SON (a) geopotential height (gpm) and corresponding wave activity fluxes at 250 hPa (m2/s2), and (b) SST (°C) obtained by linear regression against SON interannual snow cover index in the central-eastern Tibetan Plateau region. (c) Differences of SON geopotential height (gpm) at 250 hPa between sensitivity experiments with both positive eastern North Pacific and negative western North Atlantic SST anomalies added to climatological SST only and a control simulation with climatological SST. The scale for wave activity flux vectors is shown at the bottom-left corner. The red boxes in (b) denote the domain of the eastern North Pacific and western North Atlantic SST anomalies specified in the sensitivity experiments in (c). The purple contours in (a) and the dotted regions in (b), respectively, denote geopotential height and SST anomalies significant at the 95% confidence level.
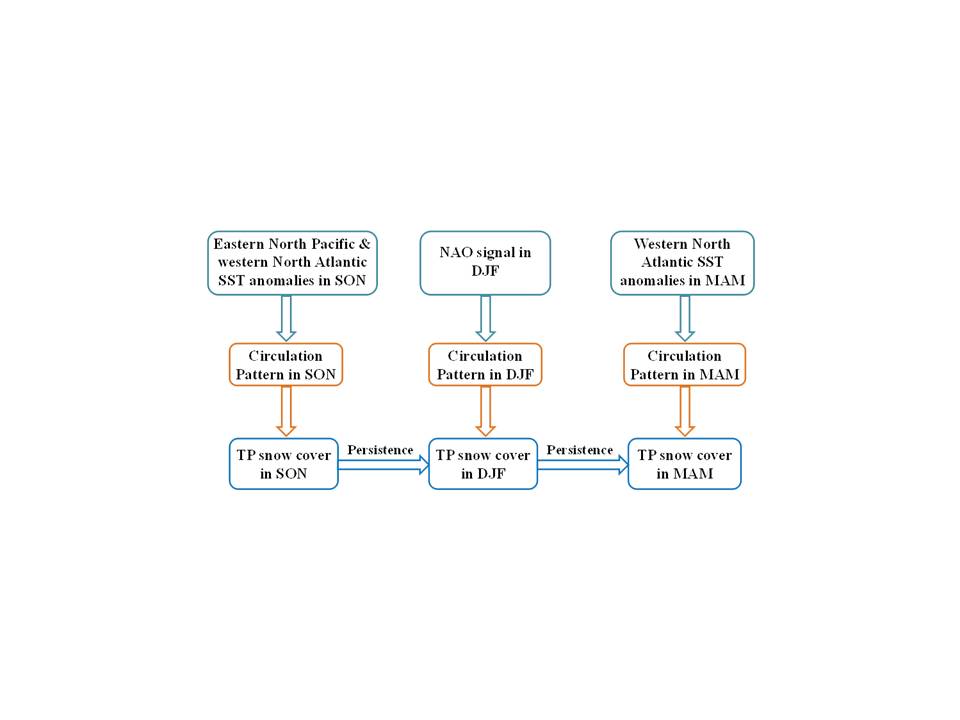
Figure 3. Schematic diagrams showing the formation of cold season Tibetan Ppateau snow cover anomalies and the plausible factors.
Citation:
Wang, Z.-B., R.-G. Wu, P. Zhao, S.-L. Yao, and X.-J. Jia. 2019: Formation of snow cover anomalies over the Tibetan Plateau in cold seasons. J. Geophys. Res.-Atoms., 124, https://doi.org/10.1029/2018JD029525.
Web: https://agupubs.onlinelibrary.wiley.com/doi/abs/10.1029/2018JD029525
Contact: WU Renguang, renguang@mail.iap.ac.cn
E-mail: lasg_newsletter@lasg.iap.ac.cn
Editors: Chuanyi Wang (wangcy@lasg.iap.ac.cn), Kangjun Chen(ckj@lasg.iap.ac.cn)