State Key Laboratory of Numerical Modeling for Atmospheric Sciences and
Geophysical Fluid Dynamics (LASG)
Institute of Atmospheric Physics, Chinese Academy of Sciences

Vol. 7/No.7 October 2018
[Climate Dynamics]Diagnosis of surface heat flux-SST correlation reveals the model ability in simulating intraseasonal air-sea interactions
Highlights: A distinct relationship between intraseasonal net surface heat flux (NHF) and SST variations is identified over the northern tropical Indo-western Pacific during boreal summer in the NCC.NorESM1-M model. NHF has a weak correlation with the SST tendency but a large negative correlation with SST in the NCC.NorESM1-M model, whereas NHF has a large positive correlation with the SST tendency and a weak correlation with SST in observations and some other climate models. The above relationship indicates that the SST change is contributed by NHF in observations and in the NCC.inmcm4 model, whereas the SST change is attributed to oceanic processes in the NCC.NorESM1-M model.
Summary: Climate model is an important tool in studies of climate variability, predictability, and projection. The performance of the climate models needs to be evaluated before their use in climate studies. One important aspect of concern is the inter-relationship among variations in atmosphere, ocean, and land on different time scales in climate models.
Recently, Prof. WU Renguang and Ms YOU Ting compared the intraseasonal NHF-SST and NHF-SST tendency correlation during boreal summer over the northern tropical Indo-western Pacific in observations and climate models. It is found that the NCC.NorESM1-M model displays a relationship between intraseasonal NHF and SST variations remarkably different from observations and other climate models. In observations and INM.inmcm4 model, NHF-SST correlation is small and NHF-SST tendency correlation is largely positive in most regions (Figs. 1a-d). The above features suggest that NHF is an important factor in intraseasonal SST variations in most of the tropical North Indian Ocean and western North Pacific in observations and the INM.onmcm4 model. In the NCC.NorESM1-M model, NHF-SST correlation is largely negative and NHF-SST tendency correlation is small in most regions (Figs. 1e-f). The above difference suggests that SST induces intraseasonal NHF variations in the tropical Indian Ocean and western North Pacific in the NCC.NoreSM1-M model, which is in sharp contrast to observations and the INM.inmcm4 model.
Detailed analysis of intraseasonal variations in the South China Sea region conducted by Prof. WU and Ms YOU reveals distinct processes for intraseasonal SST variations in observations and the INM.inmcm4 and NCC.NorESM1-M models. In observations and the INM.inmcm4 model, precipitation and SST variations are in quadrature (Figs. 2a-b). Atmospheric ISO-induced shortwave radiation (SWR) and latent heat flux (LHF) anomalies contribute largely to the SST change. Additional contribution to the SST change comes from wind-induced entrainment in observations (Fig. 2a) and from both wind-induced advection and entrainment in the INM.inmcm4 model (Fig. 2b). In the INM.inmcm4 model, surface air humidity varies in quadrature with SST (Fig. 2b) and they are results of surface evaporation and wind advection. In the NCC.NorESM1-M model, precipitation and SST variations are in phase (Fig. 2c). The SST change is primarily contributed by oceanic processes, including wind-induced Ekman advection and entrainment (Fig. 2c). Positive SST anomalies induce more surface evaporation and higher surface air humidity. This destabilizes the atmospheric boundary layer in favor of convection and precipitation. The related cloud increase reduces SWR (Fig. 2c). The SWR and LHF have a damping effect on the SST change.
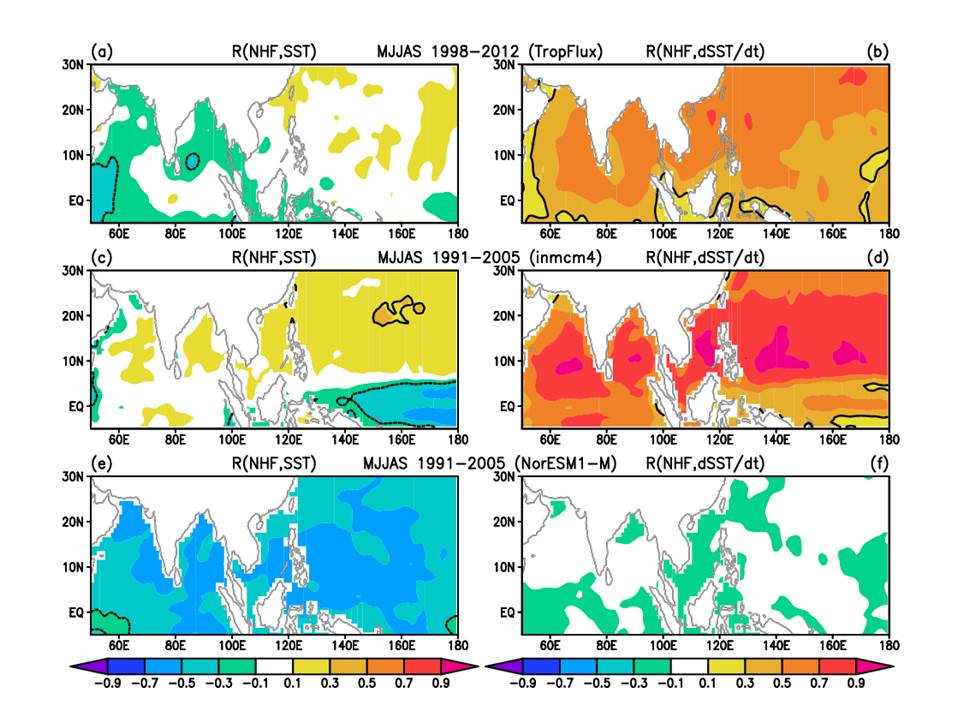
Fig. 1. Grid point local correlation of MJJAS 10–60-day variations between NHF and SST (a, c, e) and between NHF and SST tendency (b, d, f) in TropFlux data during 1998–2012 (a, b), in the INM.inmcm4 model during 1991–2005 (c, d), and in the NCC.NorESM1-M during 1991–2005 (e, f). Contours denote correlation coefficient of 0.293 reaching the 99% confidence level. Positive NHF is directed into the ocean.
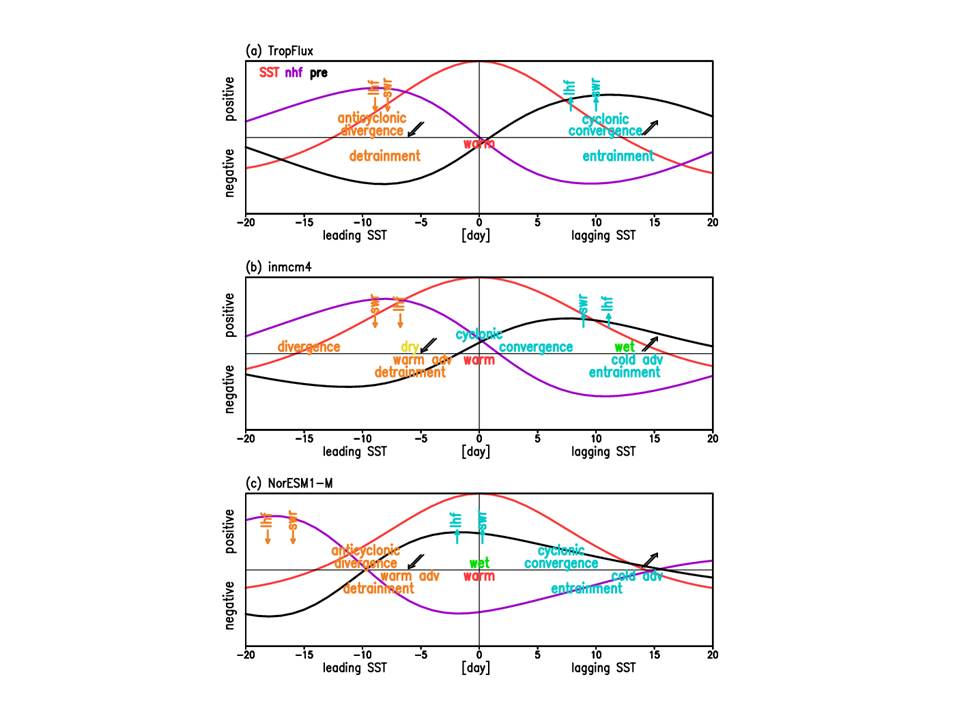
Fig. 2. Schematic diagrams summarizing the temporal relationship of different quantities with respect to SST in the South China Sea in observations (a), the INM.inmcm4 model (b), and the NCC.NorESM1-M model (c). Red curve is SST, purple curve is NHF, and black curve is precipitation. Double arrows represent anomalous surface winds. Vertical arrows denote the direction of surface heat fluxes.
Citation: Wu, R., and T. You, 2018: Summer intraseasonal surface heat flux-sea surface temperature relationship over northern tropical Indo-western Pacific in climate models. J. Geophys. Res., 123, 5859-5880, doi:10.1029/2018JD028468.
Web: https://agupubs.onlinelibrary.wiley.com/doi/10.1029/2018JD028468
Contact: WU Renguang, renguang@mail.iap.ac.cn
E-mail: lasg_newsletter@lasg.iap.ac.cn
Editors: Chuanyi Wang (wangcy@lasg.iap.ac.cn), Kangjun Chen(ckj@lasg.iap.ac.cn)